Rigol RSA5000 Realtime Spectrum-Analyzers + VNA RSA5032, RSA5065


Promotion until 2025-12-31: RSA5000-EMI und PA included!
Benefits of the Rigol RSA5000 RTSA/GPSA Spectrum Analyzers and VNAs
- Up to 40 MHz realtime bandwidth.
- Seamless acquisition and analysis with innovative "UltraReal" technology.
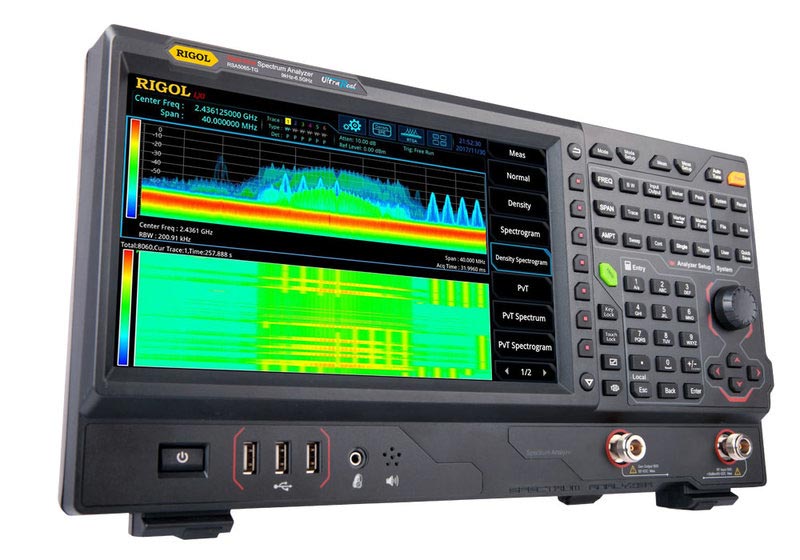
- Composite touch displays with spectrogram and density graphs.
Rigol RSA5000 Series Realtime Spectrum-Analyzers with UltraReal Technology, VNA Option
The Rigol RSA5000 series spectrum-analyzers combine the general purpose spectrum-analyzer mode (GPSA) and real-time spectrum-analyzer mode (RTSA). The GPSA mode uses the traditional heterodyne/sweeping analysis method that is used in most standard spectrum-analyzers. It sweeps through the frequency band of interest, making the measurement non-seamless. The RTSA method on the other hand uses FFT and allows seamless analysis. The RSA5000 analyzers are easy to use due to their clear front design and versatile touchscreen operation. The devices integrate five measurement modes (partly optional/upgrades) to address the challenges for multiple RF test requirements with one single instrument. They provide EMI, RTSA, VSA, and VNA (vector netword analysis) modes in addition to the traditional GPSA mode.
Spectrum Analysis Becomes "UltraReal" with RSA5000 25 or 40 MHz Realtime Bandwidth
- Seamless analysis
Seamless I/Q data acquisition in the analysis bandwidth.
Seamless spectrum analysis. - FMT
Frequency mask trigger (FMT) to trigger the measurement by sporadic or transient events in the spectrum. - Composite displays
Spectrogram - a gap-free display of the spectrum.
Density - to visualize how frequently and long signals occur.
Features
- UltraReal technology.
- Frequency 9 kHz up to 3.2 GHz or 6.5 GHz.
- Displayed average noise level (DANL): <-165 dBm (typ.).
- Phase noise: <-108 dBc/Hz (typ.).
- Level measurement uncertainty: <0.8 dB.
- Models with 3.2/6.5 GHz tracking generator.
- Min. RBW 1 Hz.
- 25 MHz, optional 40 MHz real-time analysis bandwidth.
- POI 7.45 µs.
- Multiple measurement modes.
- Various advanced measurement functions.
- Vector signal analysis measurement application (option).
- EMI measurement application and quasi-peak detector (option).
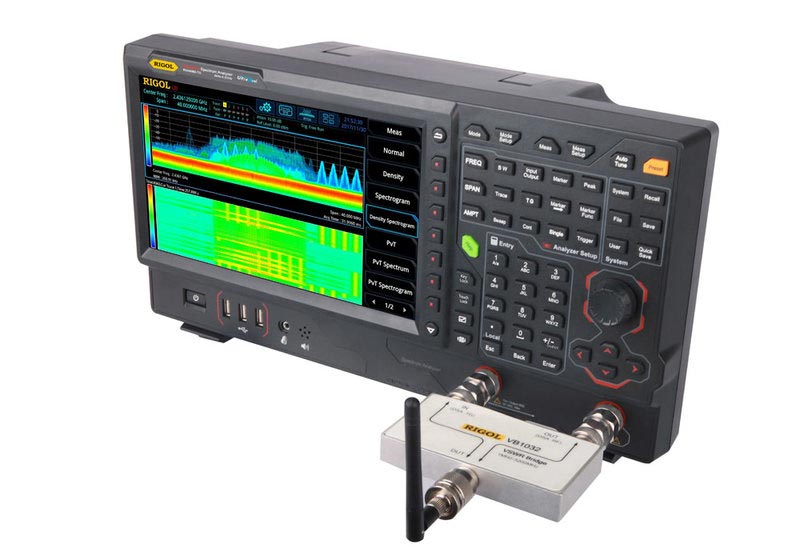
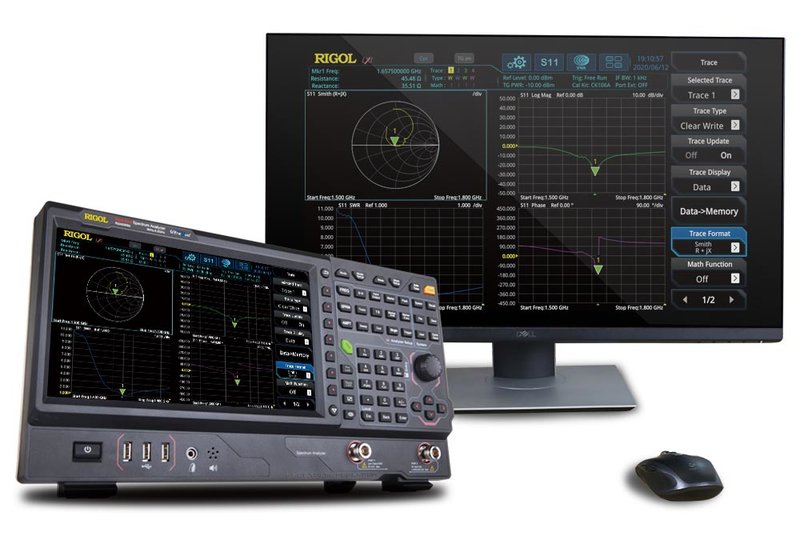
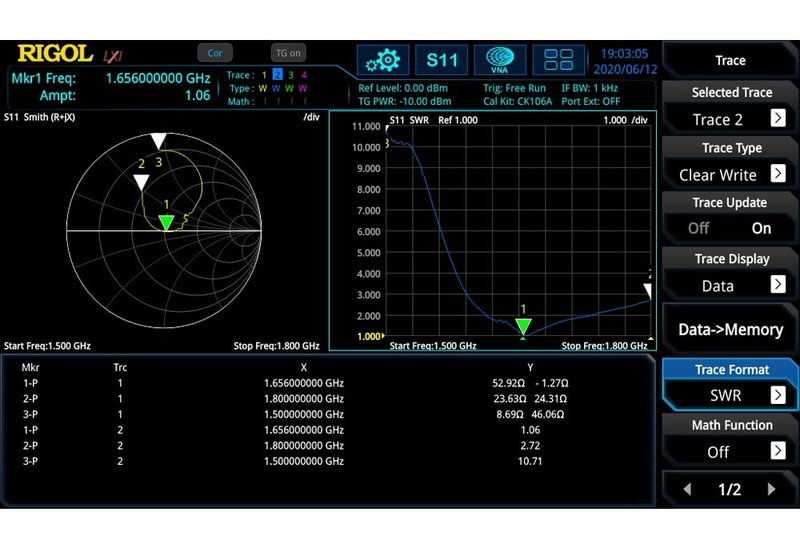
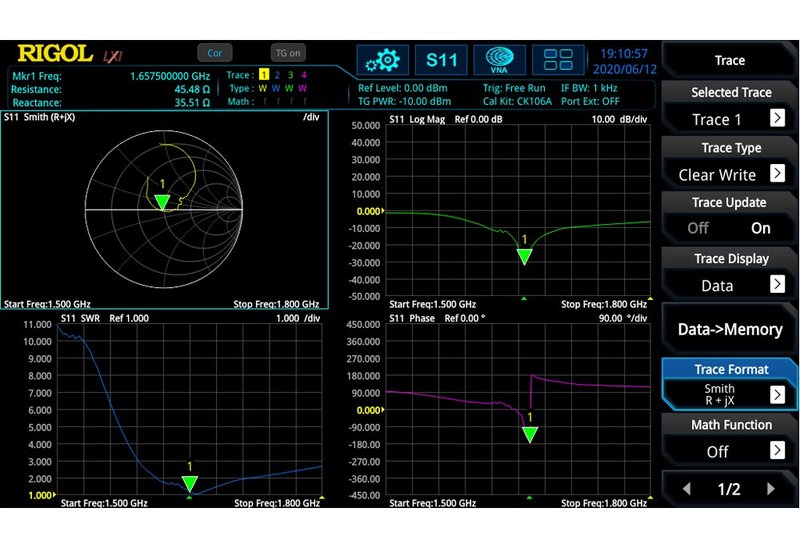
- Vector network analyzer application (VNA) - S11, S21, and DTF/distance to fault, 100 kHz to 3.2/6.5 GHz
- Multiple trigger modes and trigger masks.
- Density, spectrogram, and other display modes.
- PC software options.
- 10.1"/25.7 cm cpacitive multi-touch screen, supporting touch gestures.
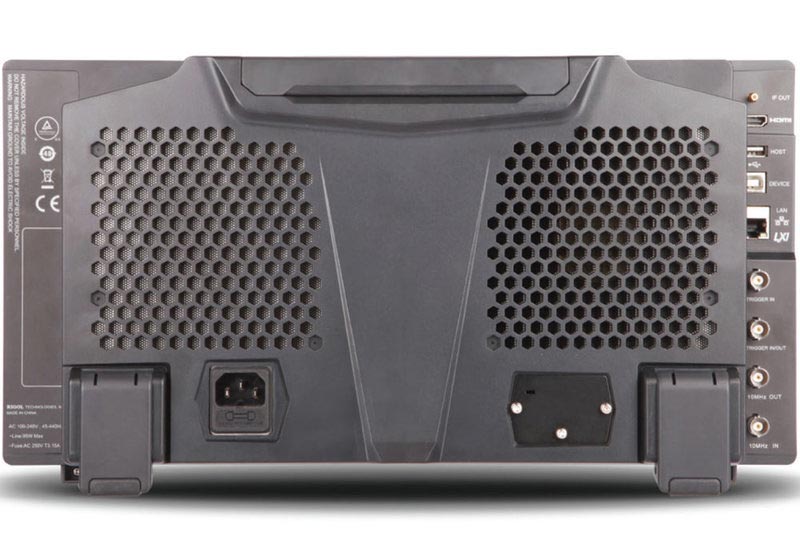
- USB, LAN, HDMI and other communication and display interfaces.
Model Overview
| Model | Touch screen | GPSA | RTSA | VSA option | EMI option | VNA | Tracking generator | Interfaces |
| RSA5032 | yes | 9 kHz...3.2 GHz (min. RBW 1 Hz, DANL <-165 dBm (typ.), VSWR <1.6 (nom.)) | 25 MHz realtime analysis bandwidth standard, option 40 MHz. POI 7.45 µs | yes | yes | - | - | USB (4x host, 1x device), Ethernet/LAN/LXI, HDMI |
| RSA5032-TG | - | yes | ||||||
| RSA5032N | yes | yes | ||||||
| RSA5065 | yes | 9 kHz...6.5 GHz (min. RBW 1 Hz, DANL <-165 dBm (typ.), VSWR <1.6/<1.8 (nom.)) | 25 MHz realtime analysis bandwidth standard, option 40 MHz. POI 7.45 µs | yes | yes | - | - | USB (4x host, 1x device), Ethernet/LAN/LXI, HDMI |
| RSA5065-TG | - | yes | ||||||
| RSA5065N | yes | yes |
Included: RSA 5032 or 5065 in one of the versions, power cable, Quick Guide (hard copy).
Software: Supported by Rigol UltraSpectrum (optional) and Rigol S1210 EMI software (free download from the Rigol website).


Frequently Asked Questions:
Question: What does a spectrum analyzer do?
Answer: What the oscilloscope is for the time domain, the spectrum analyzer is for the frequency domain. The horizontal axis here does not represent the time as in the oscilloscope, but the frequency. The vertical axis in both cases is the amplitude. The representation of a signal in the time domain shows the signal very clearly "as it is". However, in practice it is of little help in analysing the deviation of a supposed sinusoidal signal from the ideal sinusoidal shape. This is where the spectrum analyzer comes in (note: many modern digital oscilloscopes today also offer the option of a simple frequency spectrum display).
An ideal sinusoidal signal combines all of its energy into one frequency, so to speak. Other signal shapes, deviating from the ideal sine, can be generated by superimposing several to theoretically infinite ideal sine signals of different frequency and amplitude. Conversely, temporal signals can be decomposed into their frequency components. The mathematical method for this is Fourier analysis or harmonic analysis. The frequency spectrum (often just spectrum for short) of a signal represents its composition of different frequencies. In principle, a spectrum analyzer works like a receiver. It automatically searches a wide frequency range and displays the found sinusoidal signals vertically with the amplitude and horizontally with the frequency.
Question: How do spectrum analyzers work and what is GPSA/RTSA?
Answer: There are various technical methods spectrum analyzers can be based on. One possibility is the principle of Fourier analysis. In principle, this is just mathematics. However, the discrete Fourier transform (DFT) is very computationally intensive for the microprocessor. Therefore, in practice, a faster algorithm is usually used, the so-called FFT (Fast Fourier Transform). The advantage of this method is its simple technical implementation, the disadvantage is the low achievable bandwidth (at high bandwidths the dynamic range and spectral resolution are reduced).
The technique most commonly used in commercially available spectrum analyzers is based on the heterodyne principle. Instruments of this type have a more complex and elaborate design with a local oscillator, built-in measuring receivers, mixing stages and intermediate frequency stages. The relevant frequency band is tuned by a sawtooth generator, which in turn drives a local oscillator (VCO/voltage controlled oscillator). It provides the frequency for the mixing stage at the input. The signal then passes through an intermediate frequency amplifier, filter, logarithmizer, envelope detector and video filter before reaching the display. [according to Wikipedia]
There are also spectrum analyzers that offer both measurement methods - the classic hardware-based receiver principle and the software-based FFT - combined in one device. GPSA (general purpose spectrum analysis) for a heterodyne/sweeping method and RTSA (real time spectrum analysis) according to an FFT method are often used as designations here.
Question: Which technical specifications are the most important ones for spectrum analyzers?
Answer: In addition to general features such as touch screen, display size, interface equipment, etc., the values for bandwidth, DANL and RBW are probably among the most important specifications. The operating bandwidth is usually quoted as the main distinguishing feature of spectrum analyzers (for example, 9 kHz to 7 GHz) and is the first selection criterion for an application. The inherent noise (DANL/Displayed Average Noise Level) is the measure of sensitivity. The resolution bandwidth (RBW) is the smallest frequency spacing that two adjacent signals of the same amplitude may have so that a maximum determination is possible. The filter curves of the bandpass filters determine the RBW and can be between 1 Hz and 10 MHz or more.
Information on product safety:
Manufacturer:
RIGOL Technologies CO., LTD., No.8 Ke Ling Road, Suzhou New District 21516/CHN
www.rigol.com
(EU branch Germany)


Related Products


Customers also bought